Changes in household size and group quarters populations across the New Orleans metro
Published: May 17, 2011
Over the last decade, households in the New Orleans metro continued to shrink in size, but at a slower rate than in previous decades. Within New Orleans, smaller households are more prevalent in historic neighborhoods near the river, while larger households settle in neighborhoods at the city’s edge. The number of people living in metro area group quarters has declined 28 percent since 2000, with decreases in correctional facilities and nursing homes and increases in college dorms—although trends vary widely by parish.
As the Census Bureau releases in waves the details from its once–every–ten–year survey, this steady stream of data is gradually unveiling a new and deeper understanding of the changing demographics of our city, metro area, and country [1]. This brief analyzes trends in two data points recently released by the Census Bureau—average household size and group quarters population.
Average household size is useful for housing planning and policy making; for example 1 and 2 person households typically need different housing than households of 3, 4 or 5 persons. This brief looks at the changes in average household size from 1980 to 2010 as well as the distribution of household size across the metro area and within the city of New Orleans. Group quarters are residences other than households such as nursing homes, college dorms, military barracks and correctional facilities. Understanding the geographic distribution of group quarters populations across the metro area and within the city of New Orleans can help inform key service provision such as evacuation planning.
The average household size in the New Orleans metro has been falling for several decades and continued its decline from 2.59 persons per household in 2000 to 2.52 persons per household in 2010.
Over the last decade, the New Orleans metro area lost 11 percent of its total population—the largest loss rate of the 100 largest U.S. metros [2]. Children under 18 represented a disproportionate share of the New Orleans metro's population loss. The metro area lost 22 percent of its children while losing only seven percent of its adults from 2000 to 2010 [3].
It is no surprise then that the average household size of the metro area fell from 2.59 to 2.52 over the last ten years. However, it is important to recognize that household sizes have been falling across the metro area (and nationally) for several decades as birth rates have declined since the end of the baby boom in the 1960s [4]. In fact, the rate of decline in average household size across the metro area actually slowed from 2000 to 2010. However, households in the New Orleans metro are now smaller than the national average which has roughly stabilized over the last decade.
Of the seven parishes that make up the metro area, Orleans Parish experienced the most significant drop in household size over the last 10 years from 2.48 to 2.33. In contrast, St. Bernard Parish actually reversed course and experienced a slight increase in household size from 2.64 to 2.69. (This increase in household size is consistent with the fact that St. Bernard is the only parish that experienced an increase in the child share of its population from 2000 to 2010. [5]) Today, at 2.85, St. John the Baptist Parish has the largest average household size of all parishes in the metro and Orleans Parish has the smallest average household size at 2.33.
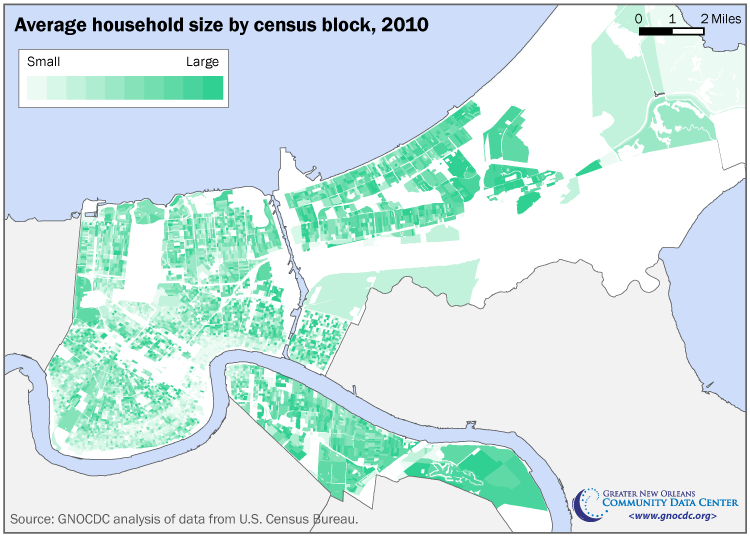
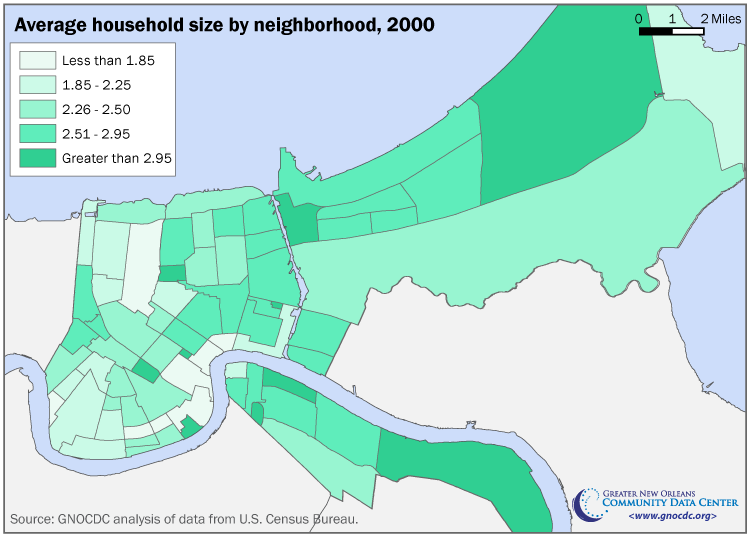
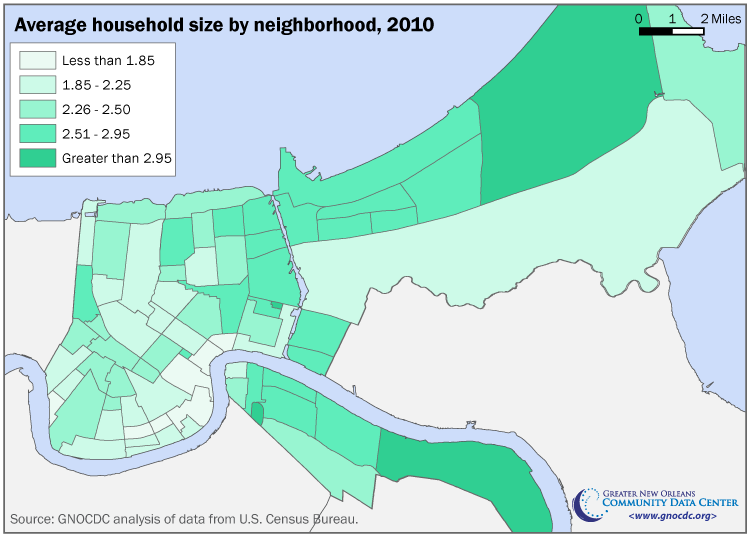
Neighborhoods near the river have the smallest average household size, while outlying neighborhoods have the largest average household size.
Across the city, the average household size varies. Notably, the neighborhoods with the smallest average household size are clustered in more historic areas close to the river. The CBD, French Quarter, Marigny, Touro, Lower Garden District, Garden District, and Black Pearl all have average household sizes of less than 1.85. Conversely, the three neighborhoods with the largest average household size—over 2.95—include two of the most far flung, recently developed neighborhoods—New Aurora/English Turn and Village de l’est. The third neighborhood with an average household size over 2.95 is the Fischer Development—one of the more remotely located public housing sites [6].
Despite its large average household size, Fischer has actually experienced a marked decrease in household size since 2000. In fact, the six neighborhoods that experienced the steepest declines in household size from 2000 to 2010 were all neighborhoods that encompassed public housing sites—many (but not all) of which have been redeveloped as mixed income neighborhoods. The average household size in the Fischer Development decreased from 4.02 in 2000 to 3.16 in 2010, in the Iberville Development from 3.04 to 2.56, in B.W. Cooper from 3.05 to 2.47. The average household size in St. Bernard (now Columbia Park) has decreased from 3.12 to 2.36, in St. Thomas (now River Gardens) from 3.44 to 2.15, and in Treme/Lafitte (now Faubourg Lafitte) from 2.55 to 2.07.
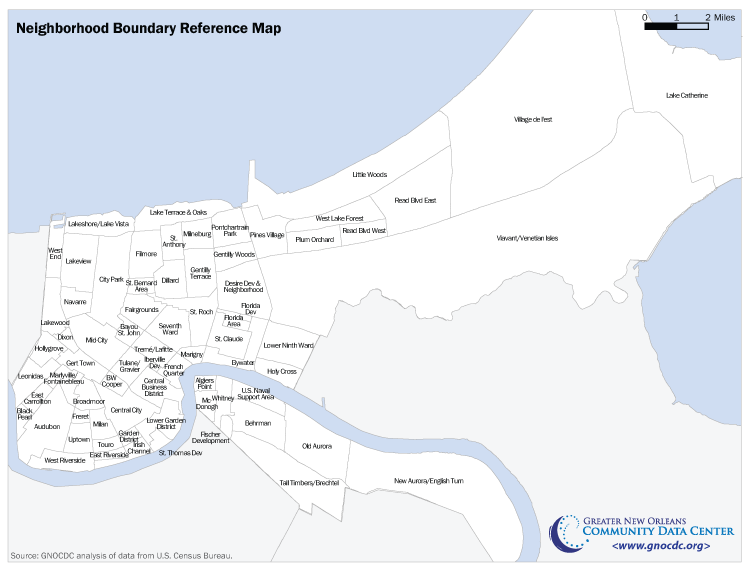
(See Neighborhood Boundary Reference Map below for neighborhood names and boundaries.)
The number of people living in metro area group quarters has shrunk 28 percent since 2000, with decreases in correctional facilities and nursing homes and increases in college dorms—although trends vary widely by parish.
More than 19,000 residents of the metro area do not live in households, but instead live in group quarters such as correctional facilities, nursing homes, military barracks, and college dorms. This is a decline of 28 percent from 2000 when the group quarters population of the metro area was more than 26,000. Thus, the group quarter population of the metro area has shrunk more dramatically than the overall population, which is down 11 percent since 2000. Nonetheless, the metro area has a sizable group quarters population, and an understanding of where group quarters populations live and their characteristics is important for key service provision such as evacuation planning.
Group quarters categories
The Census Bureau has released block level data about population in seven categories of group quarters. They are:
1. Adult correctional facilities include federal prisons and detention centers, halfway houses, local jails, military disciplinary barracks, state prisons, and other types of correctional institutions.
2. Juvenile facilities include correctional facilities intended for juveniles, non–correctional group homes for juveniles, and non–correctional residential treatment centers for juveniles.
3. Nursing facilities include facilities licensed to provide medical care for people requiring long–term non–acute care regardless of age.
4. Other institutional group quarters include in–patient hospice facilities, psychiatric hospitals, and residential schools for people with disabilities.
5. College/university student housing includes residence halls and dormitories and fraternity and sorority housing recognized by the college or university.
6. Military quarters include barracks, dormitories, and military ships.
7. Other noninstitutional facilities include emergency and homeless shelters, group homes for adult, residential treatment centers for adults, religious group quarters, workers' group living quarters.
This brief focuses primarily on the trends and location of population in adult correctional facilities, juvenile facilities, nursing facilities, college/university student housing, and military quarters.
In 2000, all seven parishes had individuals living in nursing facilities, but by 2010 most experienced a decrease in this population. Jefferson lost about 20 percent of its nursing facility population and Orleans lost nearly half. Despite these losses, Jefferson and Orleans each still have more than 1,500 residents in nursing facilities. St. Tammany's population in nursing facilities fell from 886 to 718, while St. Charles' population fell from 246 to 86. St. Bernard is now the only parish with no residents in nursing facilities. In Plaquemines and St. John the number of residents in nursing facilities increased somewhat—from 76 to 121 and from 109 to 241 respectively.
The number of adults counted in correctional facilities decreased over the last ten years in Orleans, Plaquemines, and St. Bernard as well as in St. Tammany and St. John the Baptist. In Orleans this number fell from 6,160 to 3,749, in St. Tammany from 550 to 118, in Plaquemines from 311 to 26, in St. John from 315 to 226, and in St. Bernard from 296 to 228. Only Jefferson and St. Charles experienced an increase in the number of adults in correctional facilities. The adult correction population in Jefferson grew from 691 to 943. St. Charles had the most dramatic increase from 95 to 504 adults in correctional facilities.
Jefferson, Orleans, and St. Tammany all experienced a decrease in juveniles living in institutions such as group homes, residential treatment centers, and correctional facilities. In Jefferson Parish, the number of juveniles living in institutions fell from 229 to 143, in Orleans from 86 to 52, and in St. Tammany from 886 to 718. Plaquemines and St. Bernard, on the other hand, went from having no residents in juvenile facilities to having 27 and 37 respectively. St. Charles and St. John continue to have no individuals in juvenile facilities.
The metro area’s population living in military quarters is concentrated in Orleans, Jefferson and Plaquemines. In 2000, Orleans had the largest number of people living in military quarters with 255 people, but by 2010 the number had fallen to 86. Likewise, the number of residents in military quarters in Jefferson decreased from 39 to 7. However, Plaquemines' population in military quarters increased from 20 in 2000 to 50 in 2010.
The metro area's population in college and university student housing is concentrated in Orleans and St. Tammany, and increased in both parishes over the last ten years. In 2000, there were 4,731 residents in university housing in Orleans. By 2010, this number had risen to 5,366. In St. Tammany the number of residents in student housing has grown from 66 to 76.
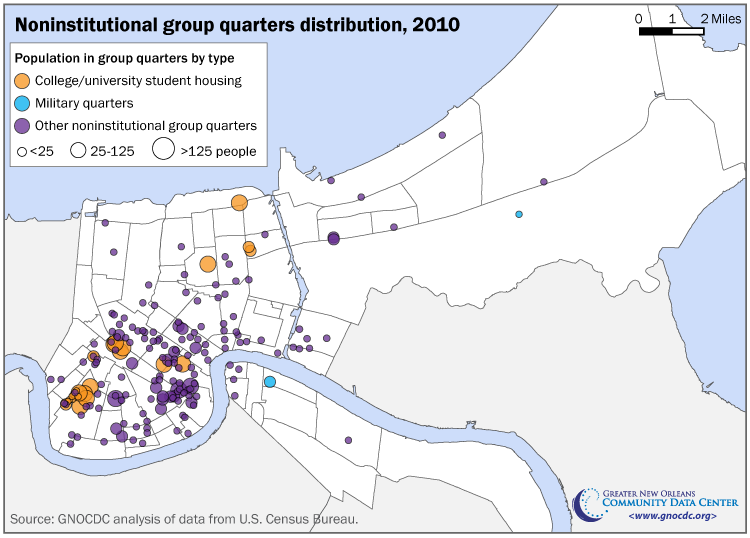
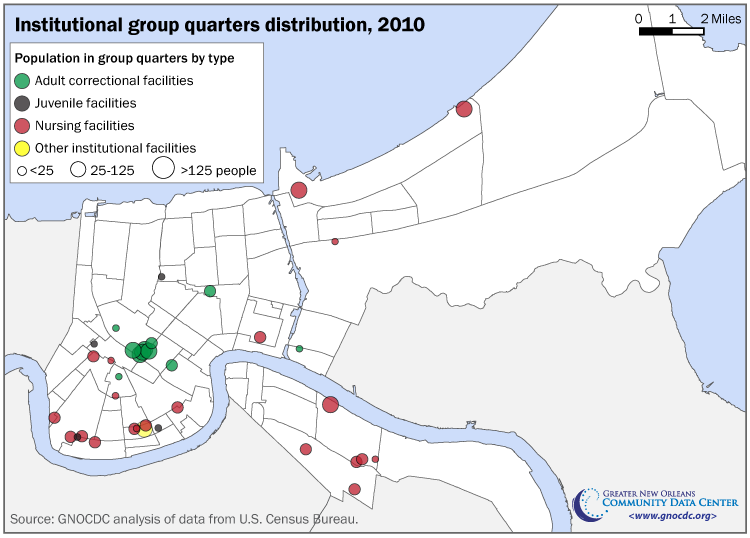
In New Orleans, 13,165 group quarters residents live in nursing homes, college dorms and other noninstitutional housing scattered around the city, and correctional facilities and military barracks clustered in a few locations.
The over 5,000 individuals living in college or university student housing in New Orleans attend one of several institutions of higher learning in the city including Tulane University, Loyola University, Xavier University, Louisiana State University and Tulane Medical Schools, University of New Orleans, Southern University of New Orleans, New Orleans Baptist Theological Seminary, and Dillard University. The Audubon neighborhood and Gert Town have by far the largest number of residents in university student housing with 3,369 and 1,065 respectively. Tulane/Gravier, the Central Business District, Lake Terrace & Oaks, Gentilly Woods, Dillard, and Marlyville/Fontainebleau each have between 64 and 224 residents living in student housing.
Military quarters are clustered on the west bank and in New Orleans east. Seventy individuals live in military quarters in the U.S. Naval Support area and 16 live in Viavant/Venetian Isles.
Fully 47 of New Orleans' 72 neighborhoods house the 2,204 residents in other noninstitutional group quarters such as group homes for adults, homeless shelters, and religious group quarters.
Adults in correctional facilities (including those in prisons and halfway houses) are largely concentrated near the intersection of Tulane and Broad. The Census 2010 counted 3,167 individuals in adult correctional facilities located within the boundaries of the Mid–City neighborhood and another 389 on the other side of Broad St. located within the boundaries of the Tulane/Gravier neighborhood. New Orleans' juvenile institutions such as correctional facilities and group homes house 52 individuals and are located in various locations from the St. Bernard Area, to Gert Town, to West Riverside, and the Lower Garden District
Nursing facilities house 1,509 individuals scattered around the city from Marlyville/Fontainebleau, Black Pearl, Audubon, West Riverside, Touro, Lower Garden District, and St, Claude, to Little Woods and Viavant/Venetian Isles in the east and Tall Timbers/Brechtel and Old Aurora on the west bank.
Limitations of the decennial census
Studies of the accuracy of the Census 2010 count will not be undertaken until more Census 2010 data has been released. However, studies of earlier decennial censuses provide guidance as to likely limitations of the Census 2010. A state–specific study of the Census 2000 undercount conducted by PricewaterhouseCoopers concluded that Louisiana's population in 2000 was undercounted by 60,698 or 1.34 percent [7]. Studies of both the 1990 and 2000 decennial censuses concluded that American Indians, Asians, African Americans, Hispanics, and children were most likely to be undercounted [8]. And a study of the 2000 decennial census concluded that some people were double counted, including college students living away from home, and families counted at both their main and vacation homes. These people were more likely to be white and higher–income [9].
[1] The New Orleans metro area is defined as the seven–parish Metropolitan Statistical Area encompassing Jefferson, Orleans, Plaquemines, St. Bernard, St. Charles, St, John the Baptist, and St. Tammany parishes.
[2] Plyer, A. (2011). Population Loss and Vacant Housing in New Orleans Neighborhoods. The Data Center. Retrieved from https://www.datacenterresearch.org/reports_analysis/population-loss-and-vacant-housing/.
[3] Plyer, A., & Ortiz, E. (2011). Shifts in Population and Loss of Children across the New Orleans Metro Area. The Data Center. Retrieved from https://www.datacenterresearch.org/reports_analysis/population-loss-and-vacant-housing/.
[4] Plyer, A., & Ortiz, E. (2011). Shifts in Population and Loss of Children across the New Orleans Metro Area. The Data Center. Retrieved from https://www.datacenterresearch.org/reports_analysis/shifts-in-population-and-loss-of-children-across-the-new-orleans-metro-area/.
[5] Plyer, A., & Ortiz, E. (2011). Shifts in Population and Loss of Children across the New Orleans Metro Area. The Data Center. Retrieved from https://www.datacenterresearch.org/reports_analysis/shifts-in-population-and-loss-of-children-across-the-new-orleans-metro-area/.
[6] According to the Census 2010, the Florida Development also has an average household size larger than 2.95. But a total of only six residents in two households were counted in this neighborhood by the U.S. Census Bureau. Therefore, it was deleted it from this analysis due to an unusually small total population.
[7] PricewaterhouseCoopers. (2001, August 7). Census 2000 Undercount Could Cost States Billions. Retrieved May 11, 2011, from U.S. Census Monitoring Board Presidential Members: http://govinfo.library.unt.edu/cmb/cmbp/reports/080601.pricewaterhouse/state_la.asp.htm
[8] Edmonston, B. (2002, May). The Undercount in the 2000 Census. Retrieved May 11, 2011, from The Annie E. Casey Foundation: http://www.aecf.org/upload/publicationfiles/undercount%20in%202000%20census.pdf
[9] Eriksen, E. (2001). An Evaluation of the 2000 census and Census Bureau Efforts to Measure the Gross and Net Rates of Undercount. North Dakota Law Review , 77, 753.
Suggested Citation: The Data Center analysis of data from U.S. Census Bureau.


