Residents in group quarters and average household size across the New Orleans metro
Published: Oct 06, 2021
Hurricane Ida highlighted the importance of planning for the needs of group quarter residents when seven nursing homes were evacuated to a warehouse where patients were left in dangerous conditions and several died. When COVID struck last year, the virus tore through senior living facilities such as Lambeth House in New Orleans and the Southeast Louisiana War Veterans Home in St. John the Baptist Parish. Individuals in prisons and jails were similarly vulnerable, although data about COVID cases and deaths among prisoners were not reported consistently and transparently.
In the face of additional climate shocks and more pandemics to come, understanding the distribution of residents in group quarters across our metro area will be essential for planning appropriate responses. Similarly, larger families living in a single home may be at greater risk of respiratory diseases when one family member becomes sick.
The 2020 Census provides an important snapshot of group quarters populations across the metro just before the pandemic hit. In fact, the once-every-ten-year census is the only source of comprehensive, location-specific group quarters data. In this brief, we examine where nursing homes, jails, college dorms, and other group quarters are located across the metro, and important increases and decreases in those populations over time. We also examine average household size, and what it tells us about policies and practices for protecting New Orleanians during pandemics and other disasters.
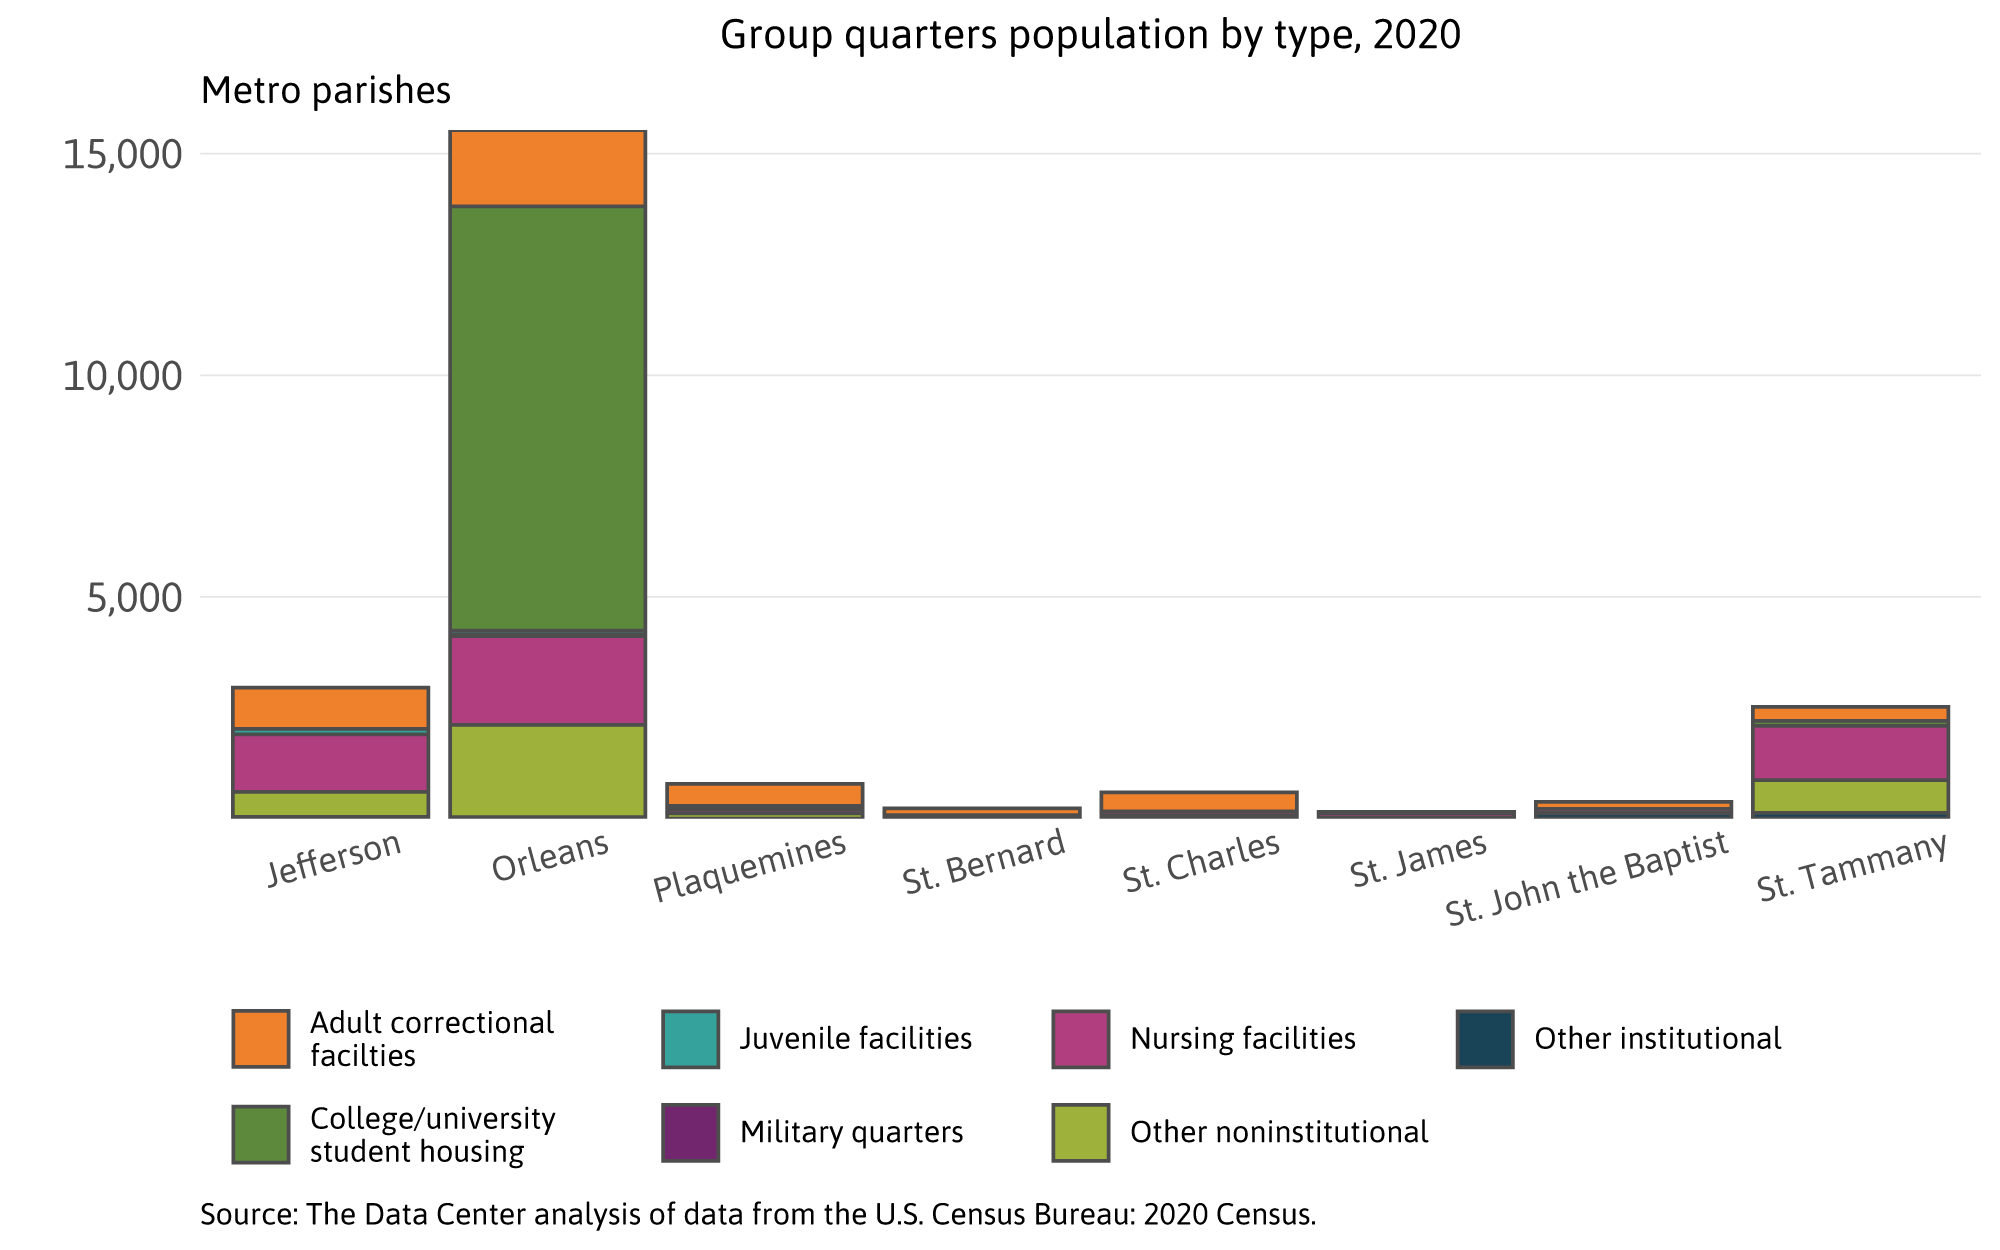
Fully 23,152 people live in group quarters in metro New Orleans, of which more than half of whom live in the city of New Orleans and are primarily college students.
New Orleans saw a large jump in the number of people living in college and university dorms—nearly doubling from 5,366 in 2010 to 9,569 in 2020—and these do not count the students living in off-campus housing. Group quarters residents in New Orleans (and thus the entire metro) are now more likely to be college students and less likely to be incarcerated individuals. Carefully managing the spread of air-borne viruses in these close quarters is clearly crucial for managing epidemics and pandemics.
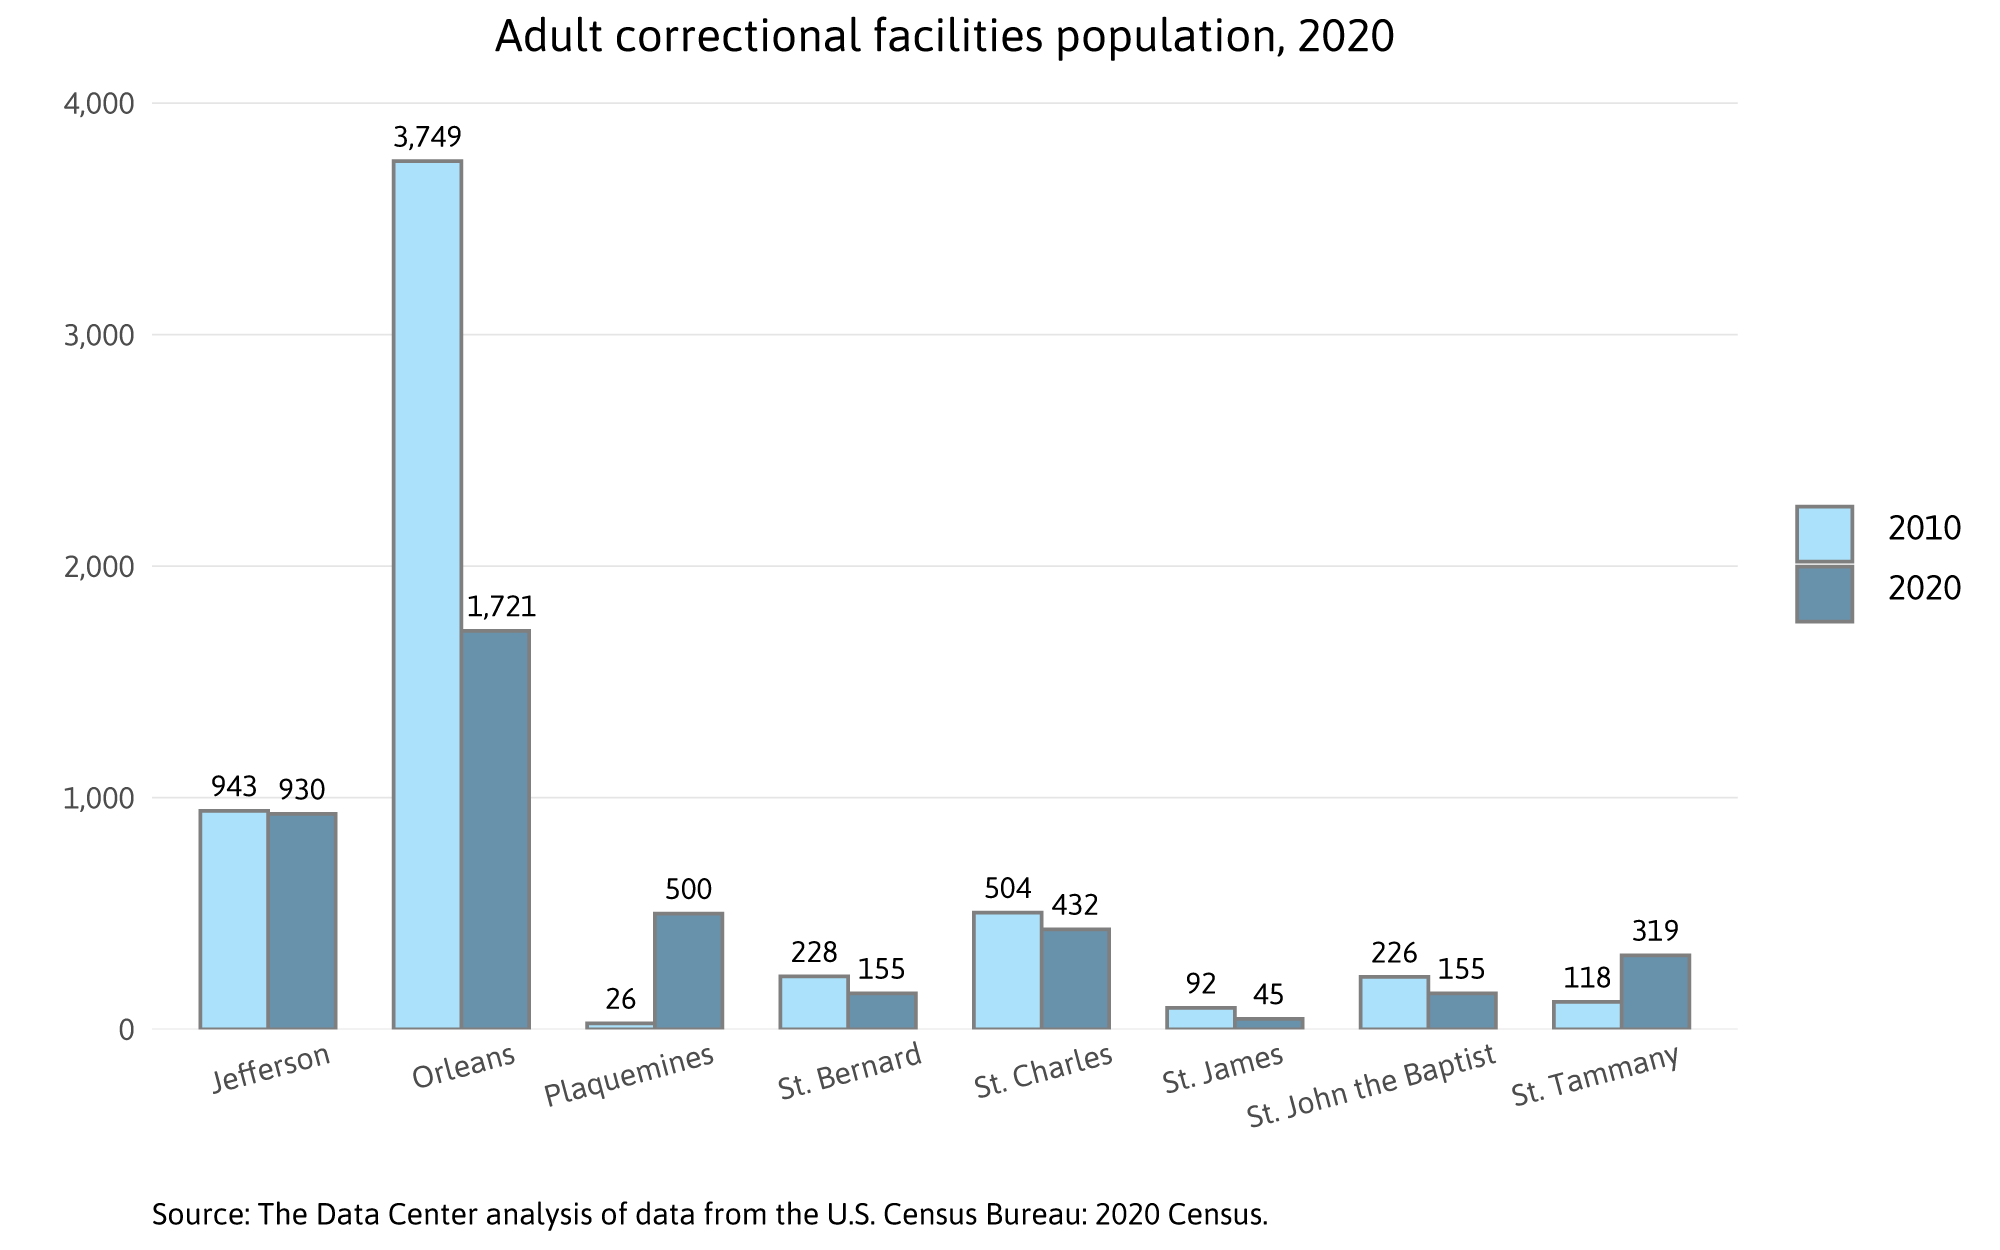
The number of people in adult correction facilities in Orleans Parish fell from 3,749 in 2010 to 1,721 in 2020—largely due to intentional efforts to reduce the size of the local jail. Still, about 0.45% of the New Orleans population was counted in an adult correctional facility compared to 0.21% of the Jefferson Parish population. Plaquemines has had a large increase in its adult correctional population, which now represents 2.13% of that parish’s population—likely due to an overly large, FEMA-funded jail that opened in that parish in 2015.
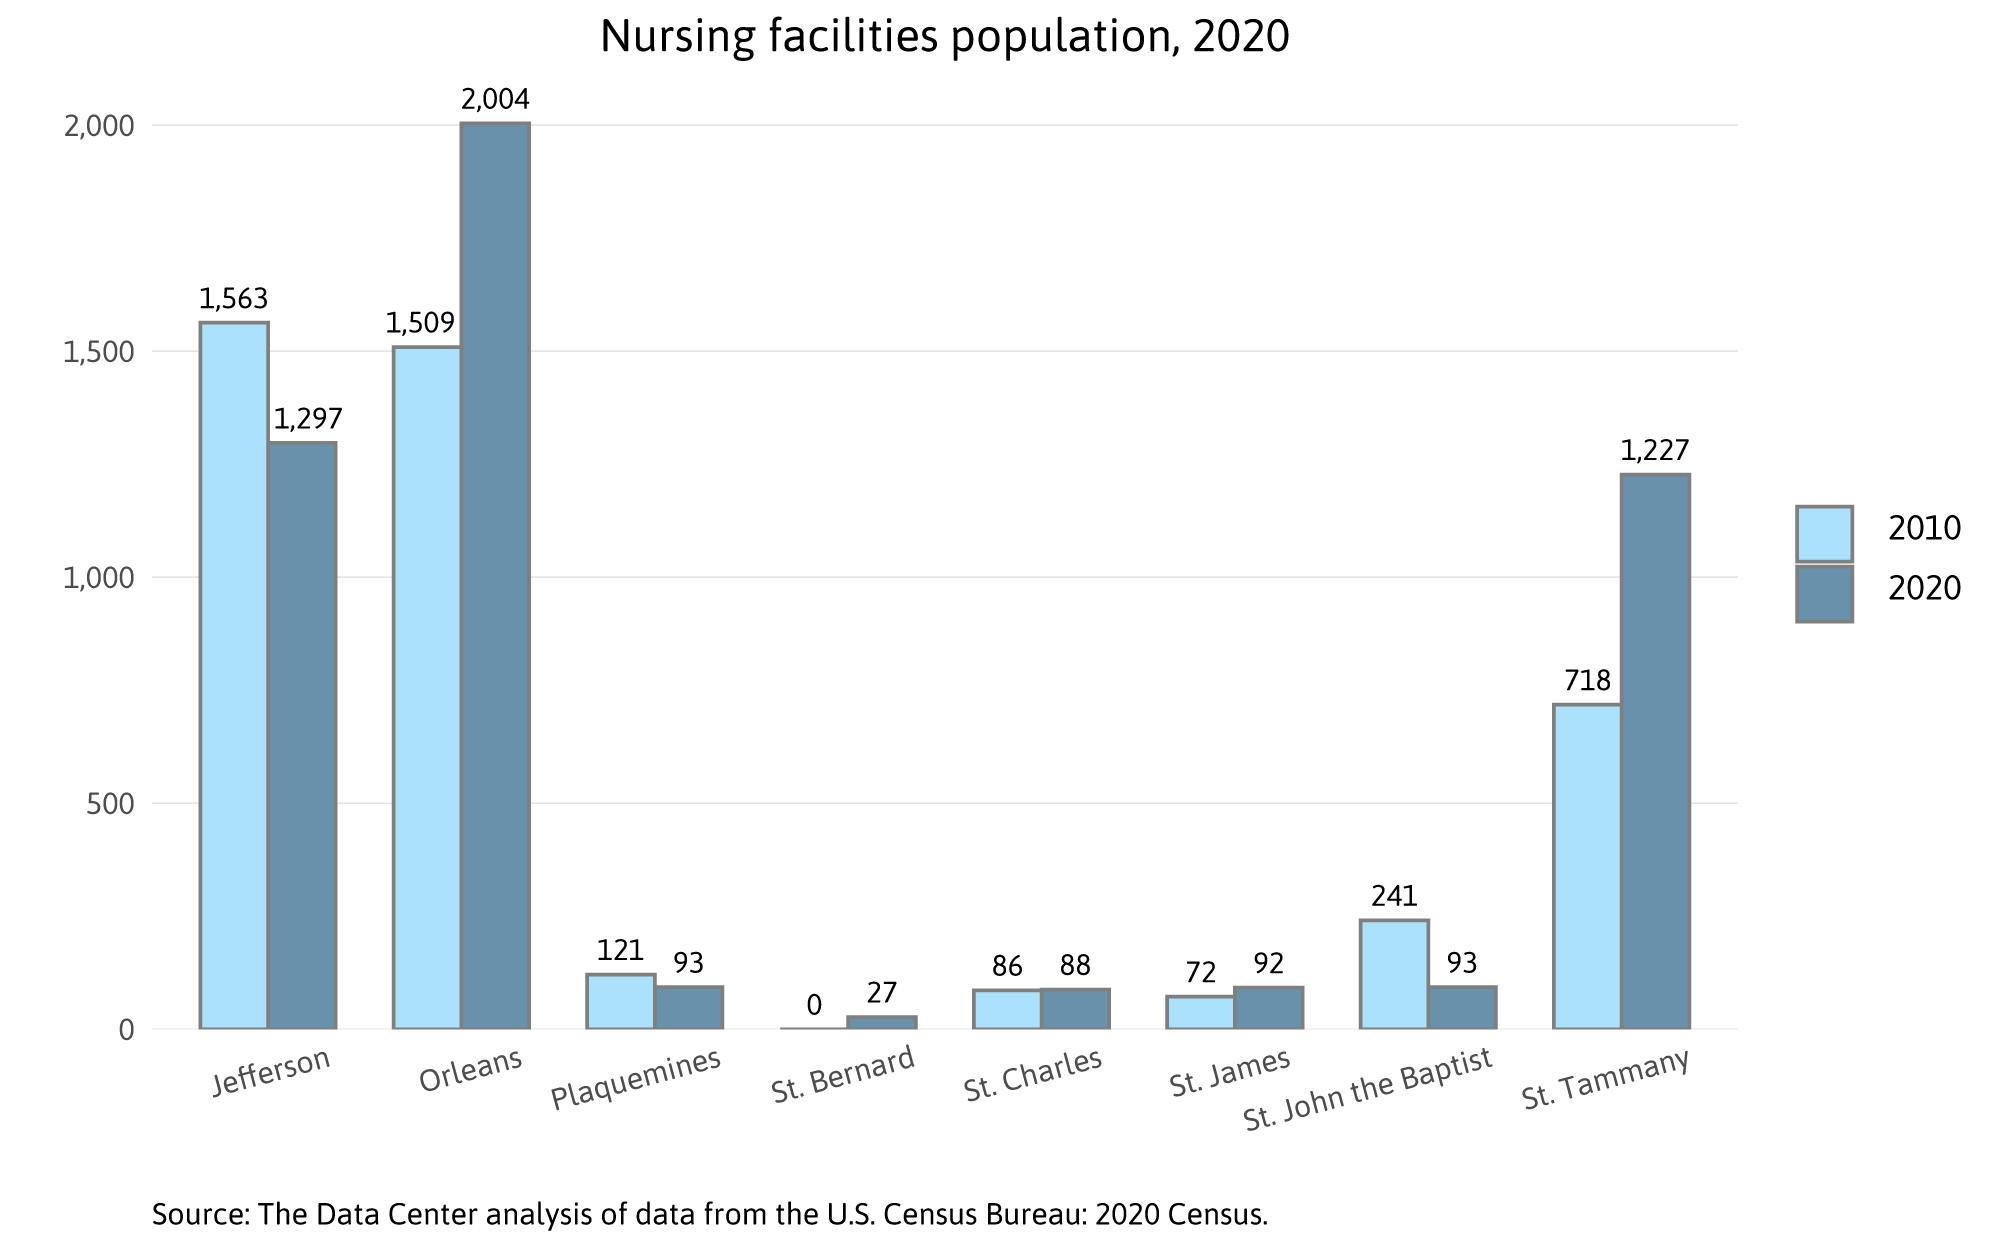
The number of people in nursing homes grew in Orleans and St. Tammany parishes, which is not surprising given the aging of the baby boomers. However, the nursing home population declined in Jefferson Parish, but remains substantial. Currently, Orleans, Jefferson, and St. Tammany have 2,004, 1,297, and 1,227 residents in nursing facilities, respectively.
New Orleans has the largest group quarters population in the metro area, representing over 4% of the city’s overall population. The maps below provide the location and relative size of New Orleans’ group quarters populations by type. The Census recorded the largest number of people in group quarters (5,536) in the Audubon neighborhood which includes Tulane and Loyola Universities and at least one nursing facility. The Census recorded the second largest number of people in group quarters (1,993) in Mid-City, which includes the Orleans Parish Prison (or “Orleans Justice Center”) and at least one nursing facility. Group quarters residents in Gert Town, which includes Xavier University, were counted at 1,335 individuals. And 1,306 group quarters residents were counted in the Lake Terrace & Lake Oaks neighborhood which includes University of New Orleans.


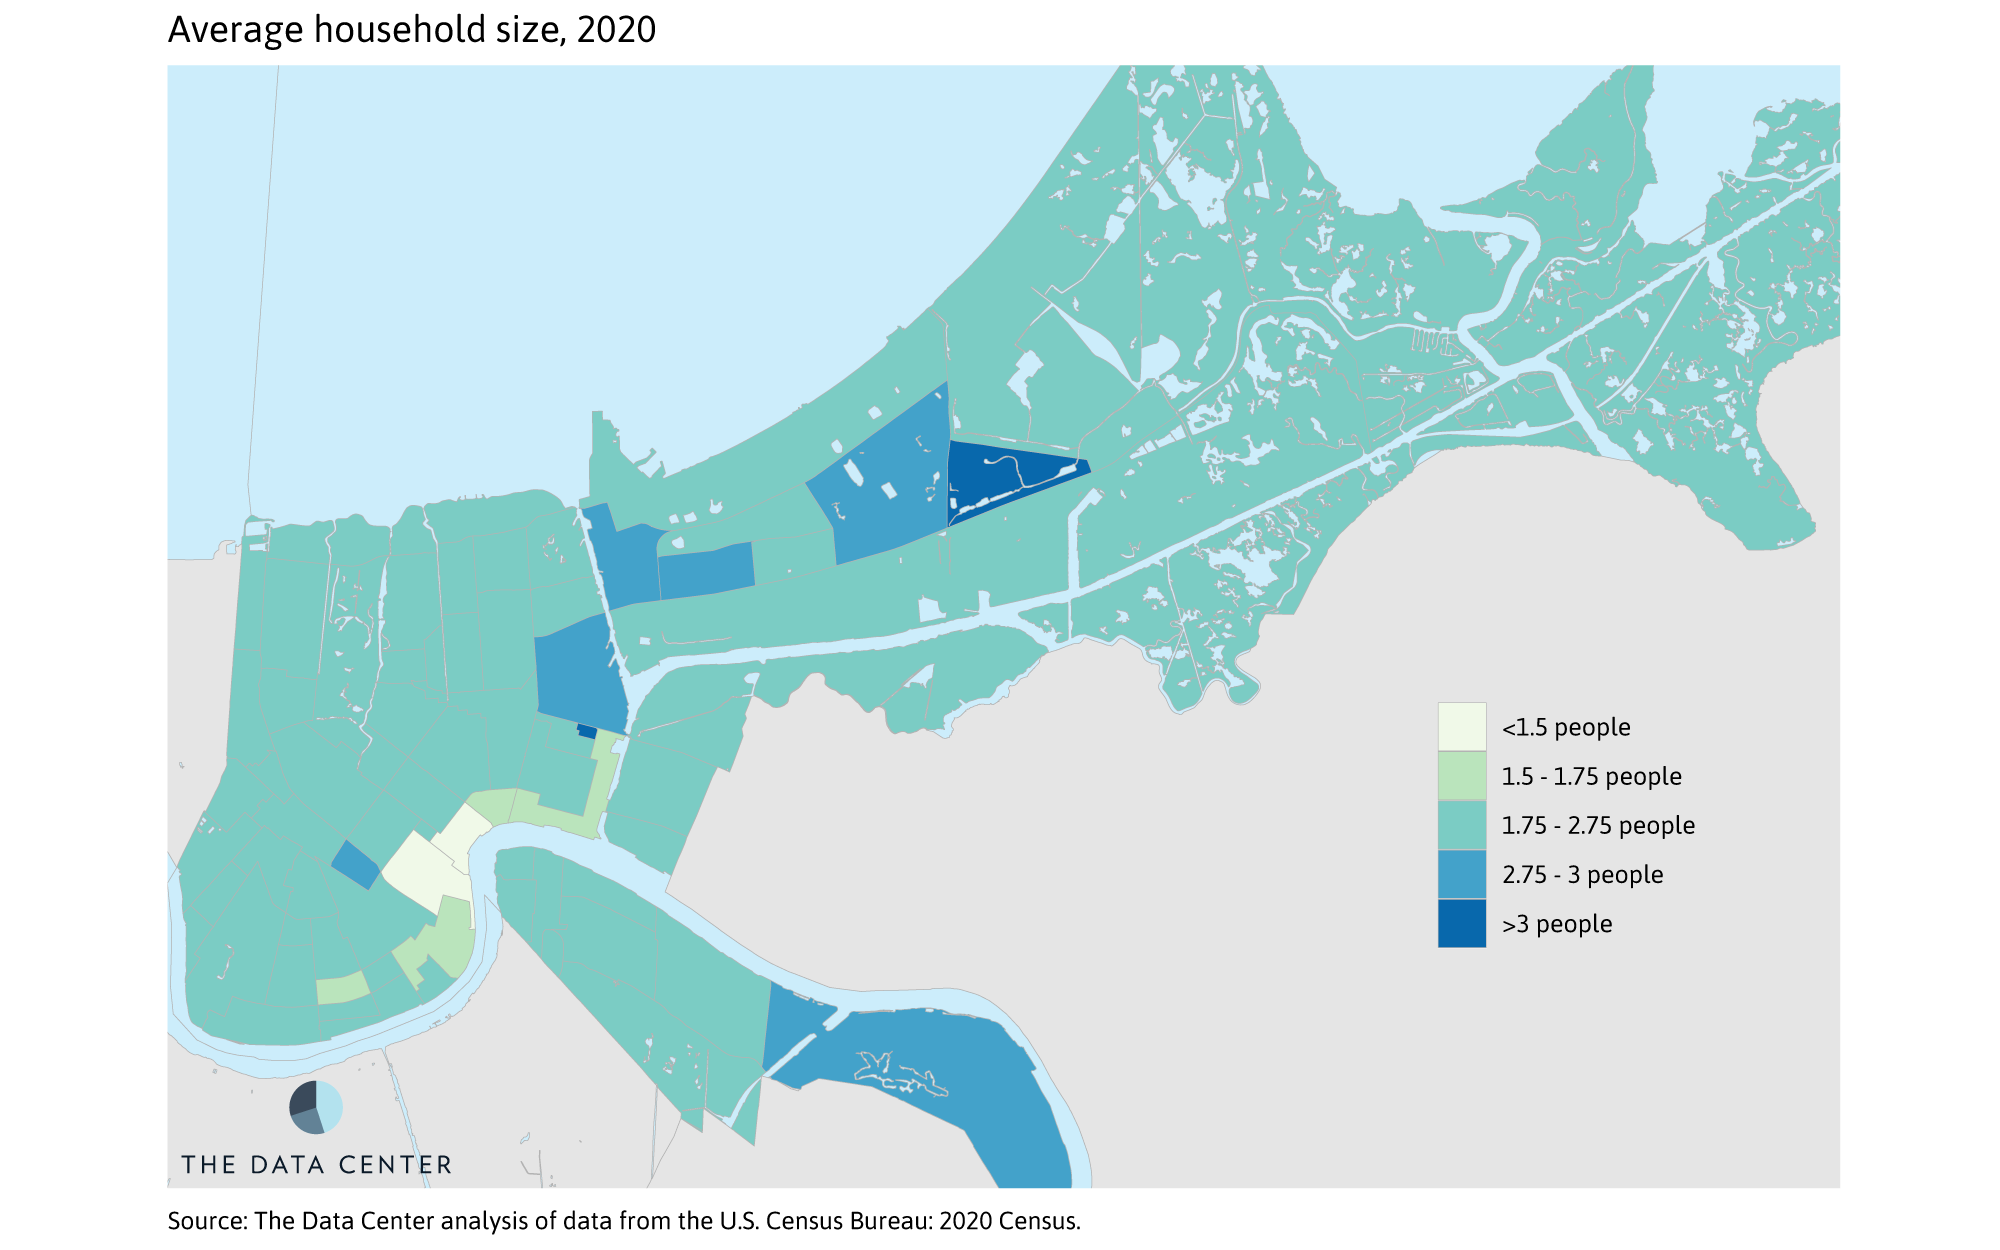
Average household size in metro New Orleans fell from 2.53 in 2010 to 2.44 in 2020, bucking nationwide trends.
Household sizes have been falling across the metro area and nationally for many decades as birth rates have declined and multigenerational families less often live together. The average household size in the United States has declined over the last two centuries, from 5.79 in 1790 to 2.48 in 2000. By 2010, average household size in the U.S. roughly stabilized at 2.47. And since 2010, average household size nationally has been inching upward as more adult children live at home and with growing Asian, Black and Hispanic populations where multigenerational households are more common.
However, average household size in metro New Orleans has continued a downward trend. From 2010 to 2020, metro New Orleans average household size fell from 2.53 to 2.44. New Orleans has the lowest average household size in the metro at 2.23 and Plaquemines has the highest average household size at 2.78.
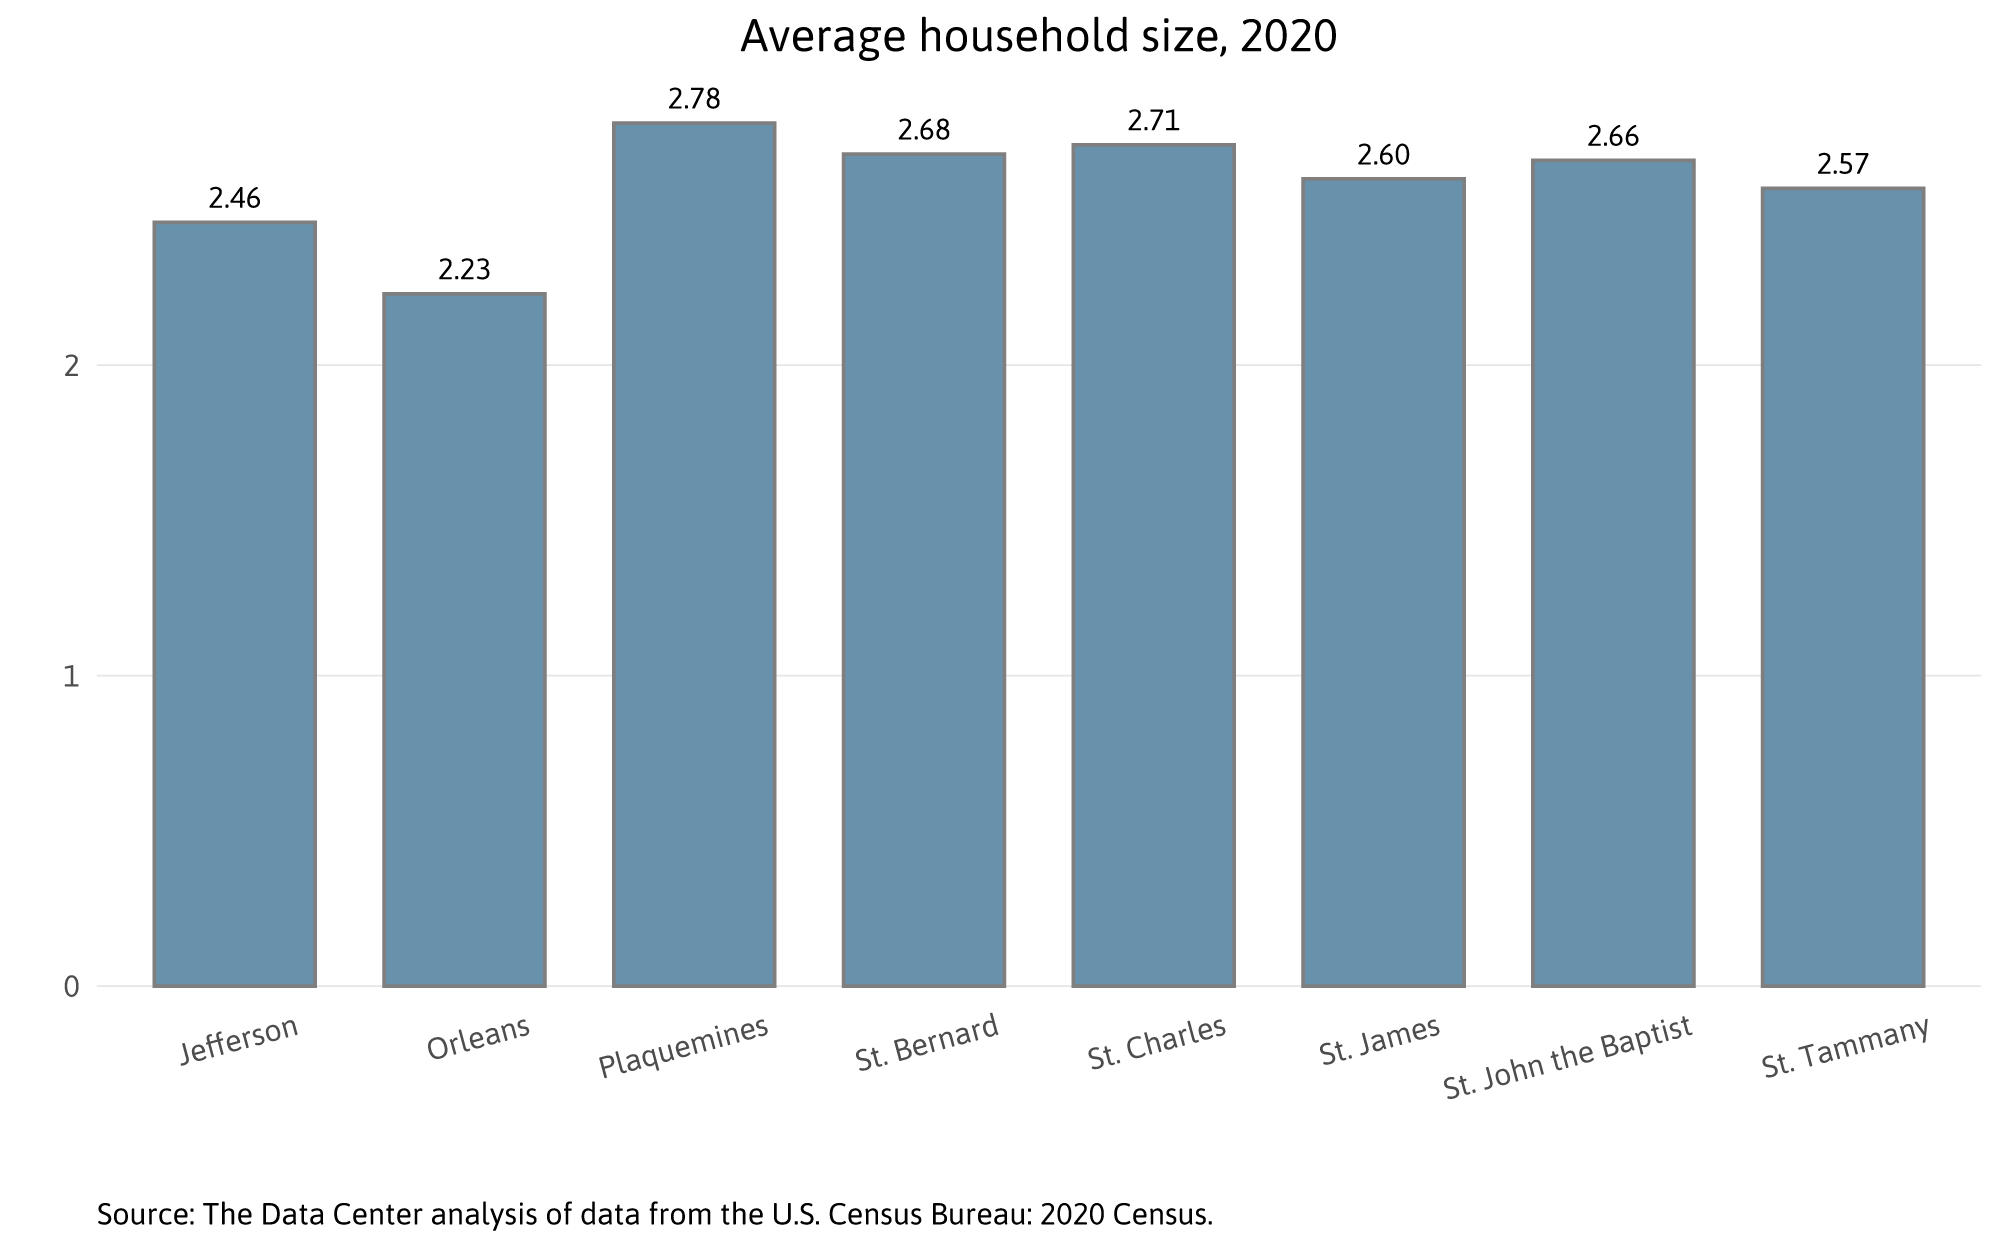
Among the parishes in the metro area, Orleans has an average household size that’s smaller than the national average. In fact, nearly half of all New Orleans households are individuals living alone. As such, officials should be thoughtful about the feasibility of guidance that New Orleanians only interact with their own household during COVID. For nearly half of all New Orleans households, that means interacting with no one.
However, average household size varies across neighborhoods. The Central Business District and the French Quarter have average household sizes below 1.5—suggesting that one-person households predominate in these two neighborhoods. The average household size in Marigny, Lower Garden District, Touro, and Bywater is not much higher (<1.75). The only two neighborhoods with average household sizes over 3 are Florida Development and Village de l’Est. Other neighborhoods with average household sizes at or above 2.75 are New Aurora/English Turn, Read Blvd East, Plum Orchard, Pines Village, Desire Development and Neighborhood, and B.W. Cooper.
Appendix: Group quarters categories
- The Census Bureau has released data about population in seven categories of group quarters. They are:
- Adult correctional facilities include federal prisons and detention centers, halfway houses, local jails, military disciplinary barracks, state prisons, and other types of correctional institutions.
- Juvenile facilities include correctional facilities intended for juveniles, non-correctional group homes for juveniles, and non-correctional residential treatment centers for juveniles.
- Nursing facilities include facilities licensed to provide medical care for people requiring long-term, non-acute care regardless of age.
- Other institutional group quarters include in-patient hospice facilities, psychiatric hospitals, and residential schools for people with disabilities.
- College/university student housing includes residence halls and dormitories and fraternity and sorority housing recognized by the college or university.
- Military quarters include barracks, dormitories, and military ships.
- Other noninstitutional facilities include emergency and homeless shelters, group homes for adults, residential treatment centers for adults, religious group quarters, workers’ group living quarters, and soup kitchens and regular food distribution spots for houseless people.
Limitations of the 2020 Census
Studies of the accuracy of every decennial census generally lag the release of the data by a couple of years. So, we do not have a definitive evaluation of the quality of the 2020 Census. However, studies of earlier decennial censuses provide some insight about likely limitations of the 2020 Census. In 2010, the Census Bureau found that non-Hispanic White individuals were overcounted by 0.8%, Black individuals were undercounted by 2.1%, and Hispanic individuals were undercounted by 1.5%. Undercounts of these groups were documented in the 1990 and 2000 decennial censuses as well. If the 2020 Census had similar undercounts/overcounts, this may slightly affect the accuracy of the neighborhood level average household size calculations reported in this brief.
The Census Bureau has already released quality metrics that point to some possible problems with the data they collected on group quarters in 2020. The pandemic disrupted the Census Bureau’s operations for collecting group quarters data. Many group quarters provided only partial information. About 18% of group quarters residents didn’t supply age information and about 30% of records were missing race. The Census Bureau had to use imputation to fill in these missing attributes. In some cases, group quarters facilities didn’t even supply a count of residents. In these cases, the Census Bureau had to use imputation to determine the number of people in the facility. In Louisiana, 4.34% of all group quarters residents were imputed—double the national average.
In addition, the data used in the analysis in this brief contains error or “noise” injected to adhere to federal laws that require the Census Bureau to protect the confidentiality of respondents. For the first time in 2020, they utilized a technique called Differential Privacy to protect the data. Differential Privacy requires a tradeoff between accuracy and privacy, and the Census Bureau has applied this methodology in such a way that data for total population in group quarters by type could be inaccurate by more than 10%. While the type and location of group quarters are reported without noise, noise has been inserted into the population counts within group quarters. This brief and the accompanying spreadsheet include data for population in group quarters by type—data that contains some uncertainty because it may be more than 10% inaccurate. Nonetheless, these data are useful in that they provide an understanding of the scale of the group quarters population by type across the metro area and in each New Orleans neighborhood. Importantly, the number of residents in each group quarters may have changed in the last year, particularly in light of the COVID pandemic and Hurricane Ida. For current information about the population in a particular group quarters facility, readers may want to reach out directly to that group quarters facility.
Notes and references
Dennis Romero, “Seven Louisiana nursing homes ordered closed for evacuating patients to warehouse before Hurricane Ida,” NBC News, September 4, 2021, www.nbcnews.com/news/us-news/seven-louisiana-nursing-homes-ordered-closed-evacuating-patients-warehouse-hurricane-n1278525
Rachel Weinstein, Allison Plyer, “Detailed data sheds new light on racial disparities in COVID-19 deaths,“ The Data Center, published June 25, 2020, www.datacenterresearch.org/reports_analysis/lack-of-data-obscures-true-levels-of-racial-inequity-in-covid-deaths/
Nicholas Chrastil, ”Report: Corrections officials in Louisiana failed to protect inmates, staff from COVID-19,” The Lens, December 15, 2020, thelensnola.org/2020/12/15/report-corrections-officials-in-louisiana-failed-to-protect-inmates-staff-from-covid-19/
”What’s Next? Predicting The Frequency and Scale of Future Pandemics,” Center for Global Development, accessed August 15, 2021, www.cgdev.org/event/whats-next-predicting-frequency-and-scale-future-pandemics
Judge Calvin Johnson (Ret.), Mathilde Laisne, and Jon Wool, “Criminal Justice: Changing Course on Incarceration,” The New Orleans Index at Ten, June 2015, s3.amazonaws.com/gnocdc/reports/The+Data+Center_NOI10_Changing+Course+on+Incarceration.pdf
Benjamin Alexander-Bloch, ”Plaquemines Parish jail opens at 10 percent capacity amid future cost concerns,“ The New Orleans Advocate, February 12, 2015, www.nola.com/news/crime_police/article_21eaa8bb-e943-5bc6-977c-08bcf078c214.html
Allison Plyer, Elaine Ortiz, Kathryn L.S. Pettit, and Chris Narducci, ”Drivers of Housing Demand, Preparing for The Impending Elder Boom,” Housing in the New Orleans Metro Series, November 2011, gnocdc.s3.amazonaws.com/reports/GNOCDC_DriversOfHousingDemand.pdf
Richard Fry, ”The number of people in the average U.S. household is going up for the first time in over 160 years,” Pew Research Center, October 1, 2019, www.pewresearch.org/fact-tank/2019/10/01/the-number-of-people-in-the-average-u-s-household-is-going-up-for-the-first-time-in-over-160-years/
Allison Plyer, ”Changes in Household Size and Group Quarters Populations Across the New Orleans Metro,“ The Data Center, May 17, 2011, www.datacenterresearch.org/reports_analysis/average-household-size-and-group-quarters/
“Who Lives in New Orleans and Metro Parishes Now?,” The Data Center, last modified July 28, 2021, www.datacenterresearch.org/data-resources/who-lives-in-new-orleans-now/
“Census Bureau Releases Estimates of Undercount and Overcount in the 2010 Census,” U.S. Census Bureau, May 22, 2012, www.census.gov/newsroom/releases/archives/2010_census/cb12-95.html
Barry Edmonston, “The Undercount in the 2000 Census,” Population Reference Bureau, May 2002, www.prb.org/wp-content/uploads/2002/05/undercount_paper.pdf
Deborah Stempowski and James Christy, ”2020 Census Group Quarters,” U.S. Census Bureau, March 16, 2021, www.census.gov/newsroom/blogs/random-samplings/2021/03/2020-census-group-quarters.html
Michael Bentley and Sarah Konya, ”2020 Census Operational Quality Metrics: Item Nonresponse Rates,” U.S. Census Bureau, August 25, 2021, www.census.gov/newsroom/blogs/random-samplings/2021/08/2020-census-operational-quality-metrics-item-nonresponse-rates.html and Mike Bentley, ”2020 Census Operational Quality Metrics Overview,” Presentation to the Census Scientific Advisory Committee, September 23, 2021, www2.census.gov/about/partners/cac/sac/meetings/2021-09/presentation-2020-census-operational-quality-metrics-overview.pdf
Pat Cantwell, “How We Complete the Census When Households or Group Quarters Don’t Respond,“ U.S. Census Bureau, April 16, 2021, www.census.gov/newsroom/blogs/random-samplings/2021/04/imputation-when-households-or-group-quarters-dont-respond.html
Paul Biemer, Joseph Salvo, and Jonathan Auerbach, ”The Quality of the 2020 Census. An Independent Assessment of Census Bureau Activities Critical to Data Quality,” First Submitted to the 2020 Census Quality Indicators Task Force July 22, 2021, www.amstat.org/asa/files/pdfs/POL-BiemerSalvoAuerbachReport.pdf
“Assessing the Reliability and Variability of the TopDown Algorithm for Redistricting Data,” U.S. Census Bureau, accessed August 20, 2021, content.govdelivery.com/accounts/USCENSUS/bulletins/2e2545b and “Production Settings Demonstration Data Released with Today’s Redistricting Data,” U.S. Census Bureau, accessed August 20, 2021, content.govdelivery.com/accounts/USCENSUS/bulletins/2ec43dd

